


Tabs
Just like in section eight the content of todays task differs from the content of the video lecture, but covers an important type of tools that is used for a variety of digital projects but especially in the domain of digital history.
Geographic Information Systems / Geospatial data
The Tabula Peutingeriana is a late antique world map depicting Europe, the Mediterranean region, North Africa, the Near East, Persia and India. Although the map is obviously distorted in terms of its geodetic spatial reference, it provides a clear insight into important transport and trade routes. Two-dimensional representations of geoinformation are fundamentally distorted. This also applies to our modern world maps. There are attempts, such as the Mercator projection, to depict our world in two-dimensional space in the best possible way that corresponds to its "actual" size. However, even 3D representations such as Google Earth are only approximate satellite images projected onto a smooth sphere. In this unit you will learn the technical basics you need to understand in order to create or interpret geovisualisations.
Geodata are digital representations of geographical information that make it possible to describe and analyse spatial relationships and properties of objects on earth. To project geoinformation onto a digital plane we need a Coordinate Reference System (CRS):
A CRS is necessary to precisely visualise the position of objects on the earth. It defines a standardised method for assigning coordinates to geographical locations. Common CRS examples are the WGS84 system for GPS or local coordinate systems.
- Coordinate point: (40.7128° N, -74.0060° W)
- Interpretation: This point represents the location of New York City. The 40.7128° N is the latitude position, and -74.0060° W is the longitude position.
Latitude: These are lines that measure distances north-south on the earth. The equator is the reference point and has a latitude of 0 degrees. The poles have latitudes of 90 degrees (north) and -90 degrees (south).
Longitude: These are lines that measure distances east-west on the earth. The prime meridian runs from the poles via Greenwich, London, and has a longitude of 0 degrees. The longitudes range from -180 degrees to +180 degrees.
The use of longitude and latitude to measure the earth was already used in the 3rd and 2nd centuries BCE by the Greek scholars Eratosthenes and Hipparchus. This division can also be granulated even more finely:
Degree (°): A degree is the largest unit and corresponds to a fraction of a circle. A circle has 360 degrees, and the degrees of latitude range from 0° to 90° (north or south) and the degrees of longitude from 0° to 180° (east or west).
Minute ('): A minute is a smaller unit, and there are 60 minutes in a degree. The degrees of latitude and longitude can therefore have up to 60 minutes.
Second ("): A second is the smallest unit, and there are 60 seconds in a minute. Latitude and longitude can therefore have up to 60 seconds.
To illustrate this using the example of a geographical position: Coordinate point: 40° 30' 15" N, 74° 0' 45" W. This means that this point is located at 40 degrees, 30 minutes and 15 seconds north latitude and 74 degrees, 0 minutes and 45 seconds west longitude.
Topology:
Topological information describes the spatial relationships between objects. This includes aspects such as neighbourhood, overlap or connection between geometric elements.
Objects:
- Polygon A: A park
- Line B: A river
- Point C: A tree
Examples of topological relationships:
- The tree (point C) is located within the park (polygon A).
- The line of the river (line B) runs through the park (polygon A).
Geographic Information Systems / Geospatial data / QGIS
The open source geovisualisation tool QGIS was developed by Gary Sherman in 2002. The project is now also commercially supported by various companies, most of which are based in the European Union. It is a complex application with many personalisation options. The interface of the programme can be intimidating when you first start it. In this unit, we will limit ourselves to a small series of tasks that will familiarise you with the most basic functions of the programme.
- Installation
- Displaying the OpenStreetMap world map
- Creating the topographical element point
- Importing a csv file with geodata
- Personalising the display of the imported geodata
1) Installation
The installation for QGIS is very straightforward compared to other tools. You can download an installer for your operating system from https://www.qgis.org/de/site/ and follow the installation instructions. On Linux you will find QGIS in your package manager.
2) Displaying the OpenStreetMap world map
Once you have started QGIS, you will find OpenStreetMap in the browser (on the left) under XYZ Tiles. XYZ Tiles are graphic data that enable zooming on digital maps. OpenStreetMap is an international open source project. You can either double-click on OpenStreetMap or right-click and select the option "Add layer to project" to load the OpenStreetMap into your project. Now you can zoom into the world map in the central view. Either with your mouse wheel or CTRL+ +/-.
3) Creating the topographical element point and line
Find London on the map and then find Baker Street near Regent's Park. To create a point on the map. Select the third icon from the left in the second top menu bar: New shapefile layer. A new window will now open in which you can create a file name for your new layer. Why a file name? The layers, i.e. graphical layers in your geovisualisation, are only managed in your project in QGIS. All layers then exist in your system as individual files that you can easily import into other projects. Define a meaningful name for your layer. For example, "Baker Street" or "Sherlock Holmes".
You must then define a geometry type. In this case, point. If you then click OK, you have created a point layer.
You can change the arrangement of the layers via drag and drop. If your layer with points is arranged under the OpenStreetMap, it will cover your points. Your points layer does not cover your OpenStreetMap as it is transparent except for the points you create on it. To create points, you must first switch the editing status. To do this, click on the symbol with the yellow pencil. Other icons in your menu bar are now no longer greyed out. These include the "Add point feature" icon. You can now click on any point on the map to create a point. For example, you can use the Sherlock Holmes Museum. A window will then appear in which you can manually assign an ID to the point. In this case, you can simply select 1.
In this way, you can also digitise other topographical elements in QGIS by hand. For example, lines or polygons.Now you will import geoinformation into QGIS and adjust the visualisation.
Geographic Information Systems / Geospatial data / Import csv
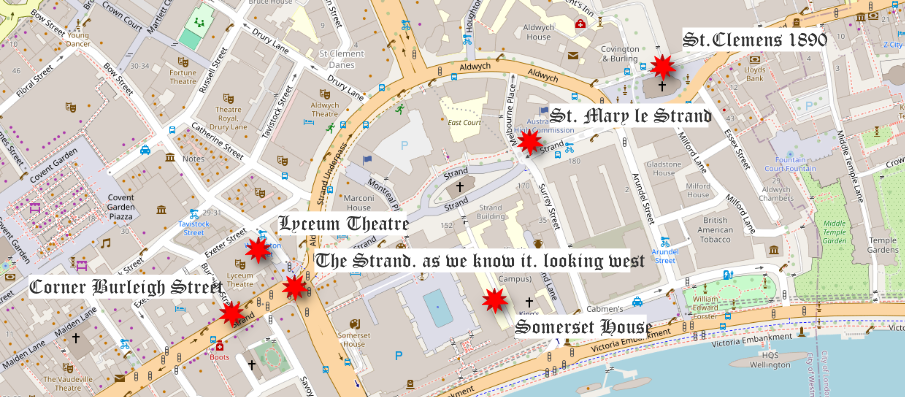
To practise the csv import in QGIS I have created a table for you. This table contains for six locations on "The Strand" the famous London street that gave its name to the Strand Magazine, descriptions of the locations, latitude and longitude as well as the link to images. These pictures are scans from a volume "London Scene from the Strand" (1974) in which illustrations from the Strand Magazine have been collected.
As with creating a point, you must add a layer. You do this by going to the top menu bar and selecting Layer >> Add Delimited Text Layer.
In the import functions, you must select the downloaded file for the File name field using the ... icon. Specify a name for your layer. Then expand the File format menu by clicking on the arrow. Select Custom Delimiters to be able to select semicolon as the separator.
In the geometry definition >> point coordinates select the long column in the X field and the lat column in the Y field.
Select CRS (Coordinate Reference System) of EPSG:4326 - WG5 B4
Also make sure that decimal (double) is selected as the format for the lat and long columns. Now you can click on Add. The points should now appear on your map in London. If this is not the case, check that your new layer is the top layer.
If you right-click on your new layer, you can select the Show labels option. The description from your import will then be displayed on the map next to the respective points.Now you can right-click again and then select the Properties option.
This opens a new window with many setting options. You can limit yourself to the Symbolisation, Labelling and Masks options. Personalise your display according to your ideas.
Here is an example of what such personalisation can look like.
Task
Table with geoinformation
Import the orte.csv file as described on this page. Personalise the visualisation according to your requirements and upload a screenshot of your display.